Four tests. The same accounting gap.
We tested four long-only Bitcoin and Ethereum grids from January to June 2026. Each booked profitable closed trades after the stated costs. Each also accumulated purchases that had not reached their sell level. When those holdings were included, every $10,000 example finished negative.
Where the $10,000 went
- Starting account$10,000Starting balance
- +$593Profit from trades that closed
- Running balance$10,593Before unsold holdings are valued
- −$2,317Loss on purchases still held
- Final account value$8,276Down 17.2%
The gap did not appear only at the finish.
The closed-trade balance kept climbing. The total account did not. The difference between the two lines is the marked gain or loss on purchases still held at each daily observation.
Closed profits rose. The account still fell.
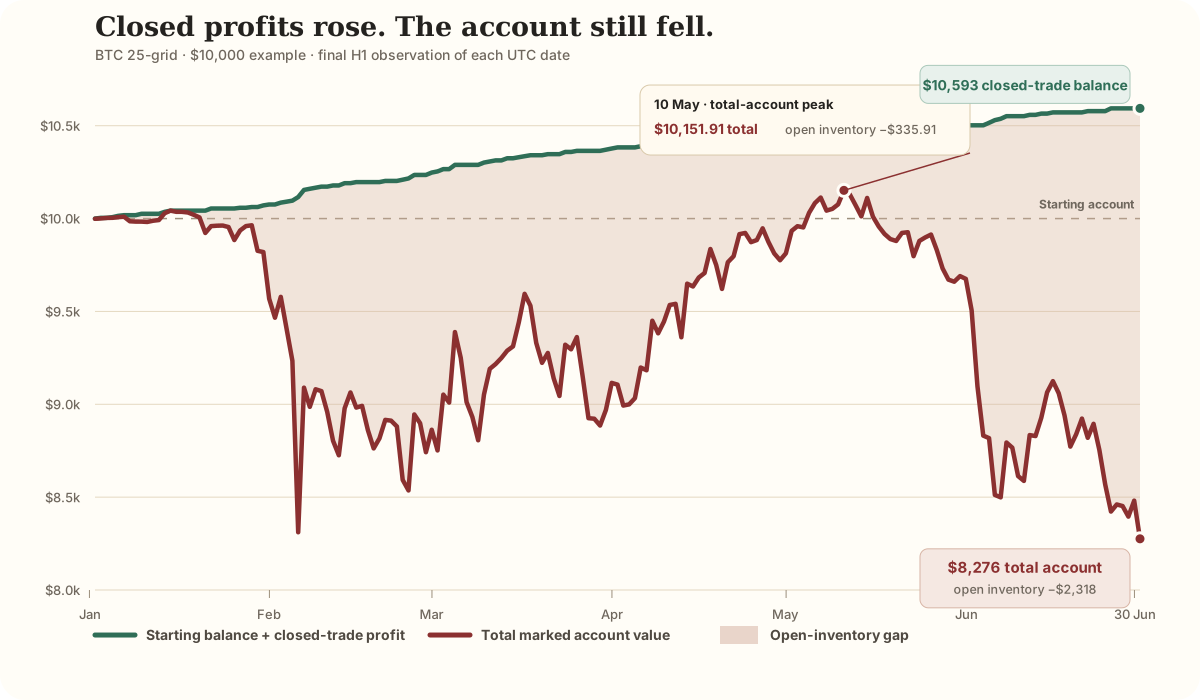
A closed trade and the total account answer different questions.
One slice closes. Another can stay exposed.
The strategy buys one equal-sized slice as price moves down through a preset level.
That slice sells one grid higher. Its completed-cycle profit is now recorded.
If their sell targets are never reached, they remain open and still change the account value.
Key distinction: Profit from closed trades answers what completed. Whole-account value answers what everything is worth now.
All four tests at a glance
Each example starts with $10,000 divided equally across the configured grid intervals.
| Test | Closed-trade reading | Final account result | Completed cycles | Purchases still held |
|---|---|---|---|---|
| BTC 25-grid25 price intervals · $400 per slice | +$593 | −$1,724−17.2% | 107 | 24 |
| BTC 50-grid50 price intervals · $200 per slice | +$227 | −$2,132−21.3% | 423 | 49 |
| ETH 25-grid25 price intervals · $400 per slice | +$792 | −$2,433−24.3% | 74 | 24 |
| ETH 50-grid50 price intervals · $200 per slice | +$569 | −$2,710−27.1% | 319 | 48 |
Dollar figures are approximate worked examples derived from the frozen basis-point results. They are not account statements or forecasts.
A narrow finding, stated honestly.
It does mean
In these four tests, profit from closed trades gave a materially different impression from the total account result. Losses on purchases still held were larger than closed-trade profits every time.
It does not mean
This does not prove that every grid strategy loses money, every grid product reports results this way, or the same result will occur in every market environment.
BTC fell 33.2% and ETH fell 47.2% during the test. That is a hostile environment for a long-only grid. Every tested grid still lost less than buying and holding the full asset over the same window.
Four terms that unlock the result
- Grid bot
- A strategy that buys and sells at a series of preset price levels.
- Completed cycle
- One purchase that was later sold at the next grid level.
- Open inventory
- Purchases still held because their sell level was not reached.
- Marked account value
- The account value after both closed trades and purchases still held are counted.
More terms used in the technical record
- Tranche
- One equal-sized slice of the account used for a grid purchase.
- Win rate
- The proportion of recorded trades that were profitable. It does not show how large the wins or losses were.
- Basis point
- 0.01%. Therefore, 84 basis points equals 0.84%.
- Spread and slippage
- Trading costs caused by the gap between an expected price and the price realistically available.
The technical record
The explanation above is simplified. The exact assumptions, measured figures and reproducibility record remain attached below.
What exactly did we test?Target, scope and evidence identity
- Target: long-only spot grid on BTC/USD and ETH/USD: buy on a downward arithmetic-grid line crossing, sell one line higher, one equal quote-notional tranche per interval, and no initial inventory.
- Claim under assay: whether completed-cycle realised profit is an adequate account-level performance measure after costs when the strategy also holds open inventory.
- Scope boundary: no vendor interface was audited, and this piece does not claim that every grid product reports performance in the same way.
- Date / methodology: 2026-07-02, Assay template v1.
- Publication state:
PUBLISHED2026-07-03.
What costs and favourable assumptions did we use?84 bps round trip and hindsight-selected ranges
| Component | Value | Source or assumption |
|---|---|---|
| Venue / markets | Kraken / XBTUSD, ETHUSD | Kraken fee assumption; public Binance H1 price paths used as a venue-representative path, not a Kraken execution reconstruction |
| Fee per side | 40 bps (0.40%) | Kraken Pro spot entry-tier taker assumption; source-checked 2026-06-11 |
| Spread | 2 bps once per round trip | Stated tight assumption, favourable to the strategy |
| Slippage | 1 bp per side | Stated assumption, favourable to the strategy |
| Depth-walk | Not applied | Favourable to the strategy |
| Round trip | 84 bps (0.84%) | 40 + 40 + 2 + 1 + 1 |
Each range was selected with perfect hindsight from the realised low and high of the same window: BTC 58,115.01–97,924.49 and ETH 1,505.68–3,402.89. That removes range-selection failure and favours the grid.
See the exact completed-cycle resultsAll four cycle-only readings
| Asset / config | Completed cycles | Net mean / cycle | Net win rate | Net total |
|---|---|---|---|---|
| BTC 25-grid | 107 | +138.6450 bps | 100.0000% | +14,835.0170 bps |
| BTC 50-grid | 423 | +26.7909 bps | 98.3452% | +11,332.5594 bps |
| ETH 25-grid | 74 | +267.4155 bps | 100.0000% | +19,788.7473 bps |
| ETH 50-grid | 319 | +89.1410 bps | 100.0000% | +28,435.9893 bps¹ |
¹ No standalone ETH 50-grid cycles-only verdict was frozen. These values are derived from the grid_cycle rows inside the frozen full-account verdict.
See the exact whole-account resultsOpen inventory included
Open tranches are closed at the final observed close solely to mark the account consistently at the end of the window.
| Asset / config | Total fills | Net mean / fill | Net win rate | Net total | Verdict |
|---|---|---|---|---|---|
| BTC 25-grid | 131 | −329.0725 bps | 81.68% | −43,108.5014 bps | negative_after_costs |
| BTC 50-grid | 472 | −225.8976 bps | 88.14% | −106,623.6450 bps | negative_after_costs |
| ETH 25-grid | 98 | −620.5916 bps | 75.51% | −60,817.9748 bps | negative_after_costs |
| ETH 50-grid | 367 | −369.1666 bps | 86.92% | −135,484.1469 bps | negative_after_costs |
The net mean, win rate and total are the frozen payload fields net_mean_bps, net_win_rate and net_total_bps, rounded only for display.
Where exactly did the gap live?Cycle income versus inventory loss
| Config | Cycle income | Inventory loss | Held tranches | Average loss / tranche | Loss / income |
|---|---|---|---|---|---|
| BTC 25-grid | +14,835.0170 bps | −57,943.5182 bps | 24 | −2,414.3133 bps | 3.91× |
| BTC 50-grid | +11,332.5594 bps | −117,956.1999 bps | 49 | −2,407.2694 bps | 10.41× |
| ETH 25-grid | +19,788.7473 bps | −80,606.7230 bps | 24 | −3,358.6135 bps | 4.07× |
| ETH 50-grid | +28,435.9893 bps | −163,920.1339 bps | 48 | −3,415.0028 bps | 5.76× |
Within each asset, average loss per held tranche stayed similar when grid density doubled. More lines created more, smaller slices of adverse inventory; they did not remove the exposure.
How was the measured timeline derived?181 daily observations, frozen inputs only
The BTC 25-grid timeline was derived offline from the frozen H1 candles, full-account fills and the frozen cycle and whole-account verdicts. It does not read Keel runtime state or call a network service.
- Observation: the final H1 label of each UTC date, producing 181 points.
- Closed-trade line: $10,000 plus full-cost profit from cycles closed by that observation.
- Total-account line: the closed-trade balance plus the full-cost marked result of every purchase still open at that observation.
- Cost model: the same frozen 84 bps round-trip cost applied at every mark.
- Keel derivation commit:
1251b3cb90e33bf49a579b3c824520891573b1b4. - Dataset SHA-256:
c39e17d4dbed9f545e44ed894ad3fb69776a29355c7e23b6f693e20c7a7717dd.
What did this test not model?Regime and material limitations
| Asset | H1 bars | First close | Last close | Window return |
|---|---|---|---|---|
| BTC | 4,344 | 87,809.23 | 58,624.71 | −33.2363% |
| ETH | 4,344 | 2,979.81 | 1,572.01 | −47.2446% |
- The range was selected with hindsight from the same realised path.
- Binance H1 bars supplied the path while Kraken supplied the fee assumption.
- No tick-level ordering, live spread history, order-book depth, partial fill, outage or rejection model was used.
- The intrabar path is an OHLC convention, not proof of the true tick sequence.
- End-of-window liquidation is a consistent mark, not a claim every live grid would close then.
- Stop rules, range resets, dynamic allocation, reinvestment, taxes and alternative grid designs were not tested.
- A genuinely range-bound path may preserve cycle income and avoid the inventory result observed here.
Published verdict and evidence provenanceInternal gate, hashes and reproduction
Under our published methodology, the full-account reading of these four grid configurations does not survive measured costs over this window. Their completed cycles remain positive after costs, but that reading excludes adverse open inventory and is not a whole-account return.
In the internal two-read form, every frozen whole-account payload records signature_positive: false and gate_met: false against a net_floor_bps of 5.0.
- Frozen evidence root:
~/assay-evidence/teardown1/. - Original manifest SHA-256:
ae05eadbbb75f865d9ac7ac2ffa114011c9cdae2ef3abec8b53e4c2418e3ca25. - Evidence engine commit:
a88bf0d738f2a1dc037785b5ee1da6410e6a306e. - Data: public Binance H1 klines; 84 bps static Kraken-based round-trip cost model.
Publication history and correctionsWhat changed between v1.0 and v1.4.2
- v1.0 · 3 July 2026: initial public release.
- v1.1 · 3 July 2026: reader-first editorial restructure, plain-English definitions, $10,000 account bridge and result cards added.
- v1.2 · 3 July 2026: opening compressed, account flow clarified, grid explainer simplified, four-test comparison converted to a responsive table, visible glossary shortened and asset cache-busting added. Verdict, assumptions, evidence and measured figures unchanged.
- v1.2.1 · 3 July 2026: stylesheet delivery moved to a cache-busted URL backed by the established site asset after the first versioned asset returned 404 at the production edge. No wording, result, assumption or evidence changed.
- v1.3 · 4 July 2026: an evidence-backed BTC 25-grid account timeline, raw 181-point dataset and derivation receipt were added. The verdict and original frozen evidence were unchanged.
- v1.4 · 4 July 2026: the measured timeline gained same-origin hover, touch and keyboard inspection. The approved static SVG remains the fallback; data, verdict and frozen evidence were unchanged.
- v1.4.1 · 4 July 2026: the illustrative grid-mechanism panel was rebuilt as a responsive three-stage explanation aligned with the measured timeline. No evidence, result, assumption or verdict changed.
- v1.4.2 · 5 July 2026: mobile-only presentation overrides removed the inherited wide-SVG minimum width, kept mechanism labels inside their cards, and aligned each final-result percentage beneath its dollar result. A static launcher now opens Numerroo-hosted Coach Steve in Assay context. No evidence, result, assumption or verdict changed.
This is a category-level assay of an open-source mechanism. No vendor, product, interface or person is named, so right of reply is recorded as not required.
Assay verdicts are educational research measurements under an explicit, published cost model. They are not financial advice, not a trading signal, and not a characterisation of any person.
Educational research only; no recommendation to buy, sell or hold anything. Past costs and behaviour do not guarantee future costs or behaviour.